Sleep EMA Exploratory Data Analysis
Replication Data for Wu et al. (2020) “Multi-Modal Data Collection for Measuring Health, Behavior, and Living Environment of Large-Scale Participant Cohorts: Conceptual Framework and Findings from Deployments”: Ecological Momentary Assessment Data (Beiwe)
|
pid |
survey.date |
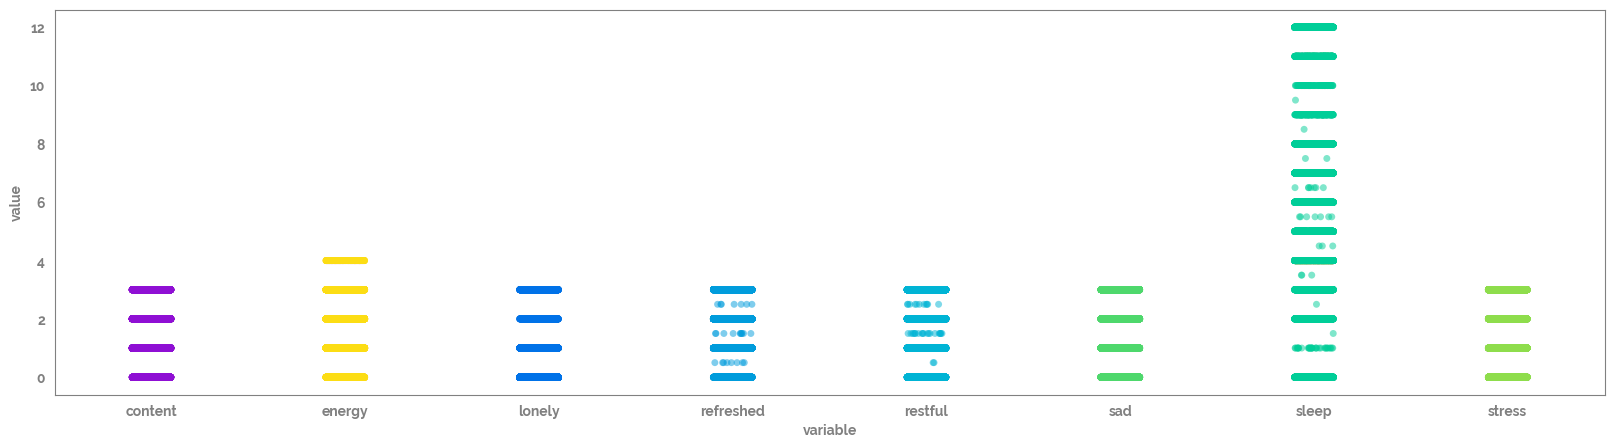
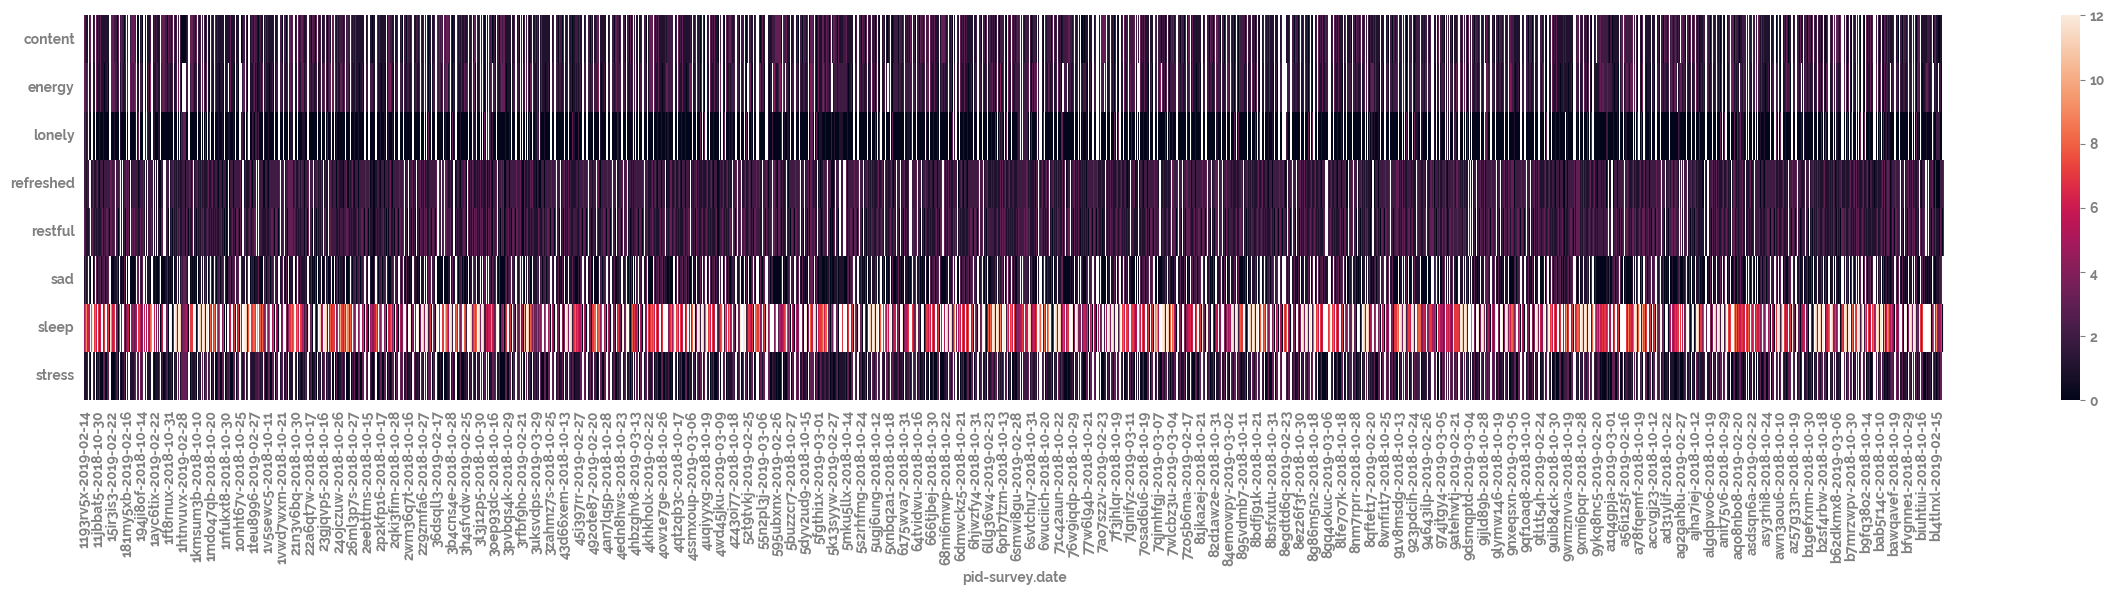
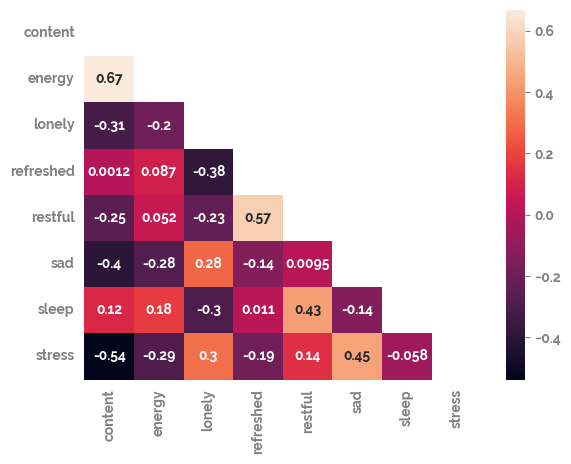
content |
energy |
lonely |
refreshed |
restful |
sad |
sleep |
stress |
| 0 |
1193rv5x |
2019-02-14 |
3.0 |
3.0 |
2.0 |
2.0 |
3.0 |
1.0 |
5.0 |
1.0 |
| 1 |
1193rv5x |
2019-02-15 |
2.0 |
3.0 |
3.0 |
1.0 |
2.0 |
2.0 |
6.0 |
1.0 |
| 2 |
1193rv5x |
2019-02-16 |
1.0 |
2.0 |
3.0 |
1.0 |
2.0 |
2.0 |
9.0 |
1.0 |
| 3 |
1193rv5x |
2019-02-17 |
1.0 |
1.0 |
3.0 |
2.0 |
2.0 |
3.0 |
9.0 |
2.0 |
| 4 |
1193rv5x |
2019-02-18 |
3.0 |
3.0 |
1.0 |
1.0 |
2.0 |
1.0 |
5.0 |
1.0 |
|
content |
energy |
lonely |
refreshed |
restful |
sad |
sleep |
stress |
| count |
24950.000000 |
24633.000000 |
24936.000000 |
29336.000000 |
29328.000000 |
24944.000000 |
24617.000000 |
24945.000000 |
| mean |
1.573347 |
1.606747 |
0.321744 |
1.717531 |
1.771856 |
1.234806 |
6.345574 |
1.522309 |
| std |
0.863883 |
0.897869 |
0.754577 |
0.790531 |
0.909771 |
1.088472 |
3.592835 |
1.131327 |
| min |
0.000000 |
0.000000 |
0.000000 |
0.000000 |
0.000000 |
0.000000 |
0.000000 |
0.000000 |
| 25% |
1.000000 |
1.000000 |
0.000000 |
1.000000 |
1.000000 |
0.000000 |
4.000000 |
1.000000 |
| 50% |
2.000000 |
2.000000 |
0.000000 |
2.000000 |
2.000000 |
1.000000 |
6.000000 |
1.000000 |
| 75% |
2.000000 |
2.000000 |
0.000000 |
2.000000 |
2.000000 |
2.000000 |
8.000000 |
3.000000 |
| max |
3.000000 |
4.000000 |
3.000000 |
3.000000 |
3.000000 |
3.000000 |
12.000000 |
3.000000 |