Methodology
The expected content of the notebook:
- Detection of time series changes in daily questionnaire data about fatigue
Data - daily questionnaire data of James
[1]:
# import sys
# import os
# import warnings

import pandas as pd
# from pandas.io.json import json_normalize #package for flattening json in pandas df
# from ast import literal_eval
import numpy as np
import matplotlib.pyplot as plt
import seaborn as sns
from sklearn.preprocessing import MinMaxScaler
from sklearn.feature_selection import VarianceThreshold
# import CRD_functions as crd

from jmspack.NLTSA import (ts_levels,
                           distribution_uniformity,
                           fluctuation_intensity,
                           complexity_resonance,
                           complexity_resonance_diagram,
                          cumulative_complexity_peaks,
                          cumulative_complexity_peaks_plot)
import miceforest as mf

import session_info
Display the session info of the notebook
[2]:
session_info.show()
[2]:
Click to view session information
-----
jmspack             0.0.3
matplotlib          3.3.4
miceforest          NA
numpy               1.19.2
pandas              1.2.3
seaborn             0.11.1
session_info        1.0.0
sklearn             0.24.1
-----
Click to view modules imported as dependencies
PIL                 8.1.2
appnope             0.1.2
backcall            0.2.0
cffi                1.14.5
colorama            0.4.4
cycler              0.10.0
cython_runtime      NA
dateutil            2.8.1
decorator           4.4.2
ipykernel           5.3.4
ipython_genutils    0.2.0
ipywidgets          7.6.3
jedi                0.17.2
joblib              0.17.0
kiwisolver          1.3.1
mpl_toolkits        NA
parso               0.7.0
pexpect             4.8.0
pickleshare         0.7.5
pkg_resources       NA
prompt_toolkit      3.0.8
ptyprocess          0.7.0
pyexpat             NA
pygments            2.8.1
pyparsing           2.4.7
pytz                2021.1
scipy               1.5.3
six                 1.15.0
statsmodels         0.12.2
storemagic          NA
tornado             6.1
traitlets           5.0.5
wcwidth             0.2.5
zmq                 20.0.0
-----
IPython             7.21.0
jupyter_client      6.1.7
jupyter_core        4.7.1
jupyterlab          2.2.6
notebook            6.2.0
-----
Python 3.9.2 (default, Mar  3 2021, 11:58:52) [Clang 10.0.0 ]
macOS-10.16-x86_64-i386-64bit
-----
Session information updated at 2021-07-18 16:14
[3]:
df = (pd.read_csv("data/user_351_smart_panel.csv")
      .rename(columns={"Unnamed: 0": "date"})
      .assign(date=lambda x: pd.to_datetime(x["date"]).dt.date)
      .drop("user_id", axis=1)
      .set_index("date")
     )
[4]:
date_range = pd.date_range(df.reset_index().date.min(),
             df.reset_index().date.max())
[5]:
df
[5]:
| validated_physical | validated_cognitive | validated_motivational | fatigue | slider | |
|---|---|---|---|---|---|
| date | |||||
| 2020-07-15 | 1.496997 | NaN | NaN | 1.385599 | NaN |
| 2020-07-18 | NaN | 3.428084 | NaN | 3.334602 | NaN |
| 2020-07-19 | NaN | 0.664916 | NaN | 0.646784 | NaN |
| 2020-07-20 | NaN | NaN | 1.532818 | 1.294205 | NaN |
| 2020-07-21 | 1.496997 | NaN | 0.766409 | 2.032702 | NaN |
| ... | ... | ... | ... | ... | ... |
| 2021-05-27 | NaN | NaN | 2.938475 | 2.481045 | NaN |
| 2021-06-01 | NaN | NaN | NaN | NaN | 63.0 |
| 2021-06-07 | NaN | 1.951801 | NaN | 1.898576 | NaN |
| 2021-06-08 | NaN | NaN | 2.938475 | 2.481045 | 57.0 |
| 2021-06-13 | NaN | 1.951801 | NaN | 1.898576 | NaN |
204 rows × 5 columns
[6]:
df = df.reindex(date_range)
[7]:
df.info()
<class 'pandas.core.frame.DataFrame'>
DatetimeIndex: 334 entries, 2020-07-15 to 2021-06-13
Freq: D
Data columns (total 5 columns):
 #   Column                  Non-Null Count  Dtype
---  ------                  --------------  -----
 0   validated_physical      86 non-null     float64
 1   validated_cognitive     113 non-null    float64
 2   validated_motivational  77 non-null     float64
 3   fatigue                 190 non-null    float64
 4   slider                  62 non-null     float64
dtypes: float64(5)
memory usage: 15.7 KB
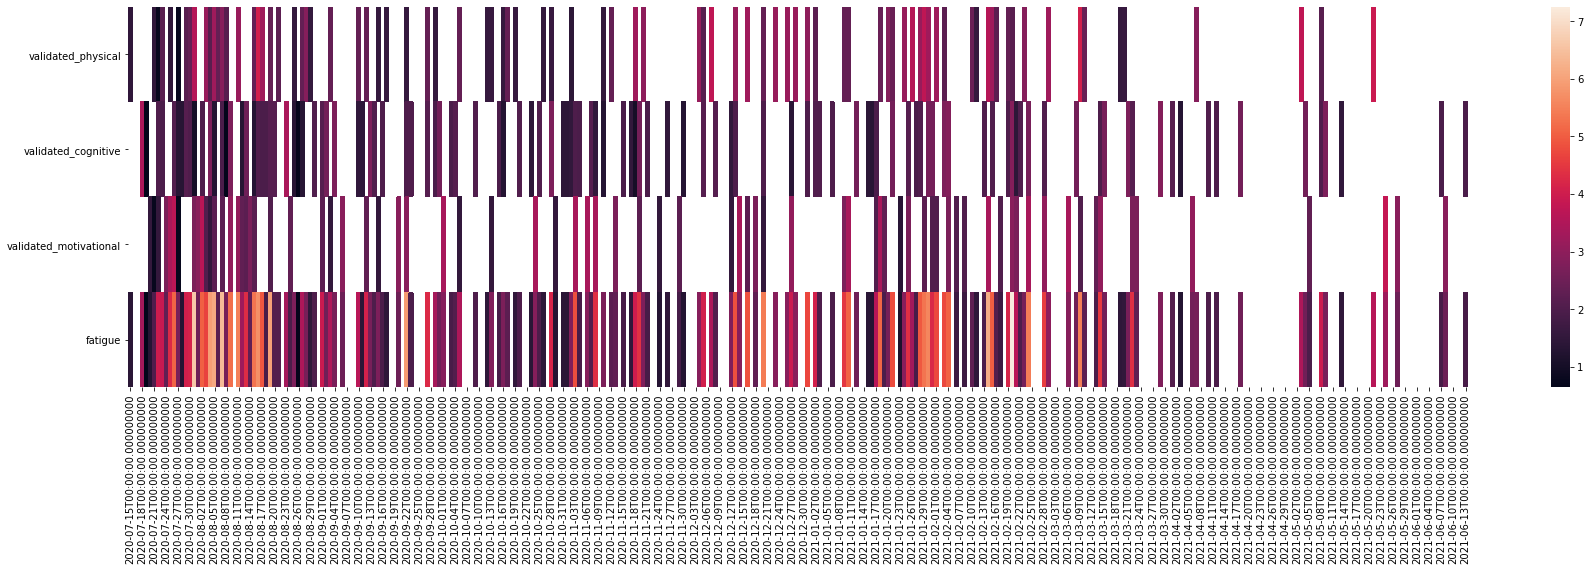
[8]:
_ = plt.figure(figsize=(30, 7))
_ = sns.heatmap(data=df
                .drop("slider", axis=1)
#                 .assign(date=lambda x: pd.to_datetime(x["date"]).dt.date)
#                 .set_index("date")
                .T
               )
[9]:
current_feature = "fatigue"
[10]:
# _ = df.set_index("date", inplace=True)
Impute the missing data
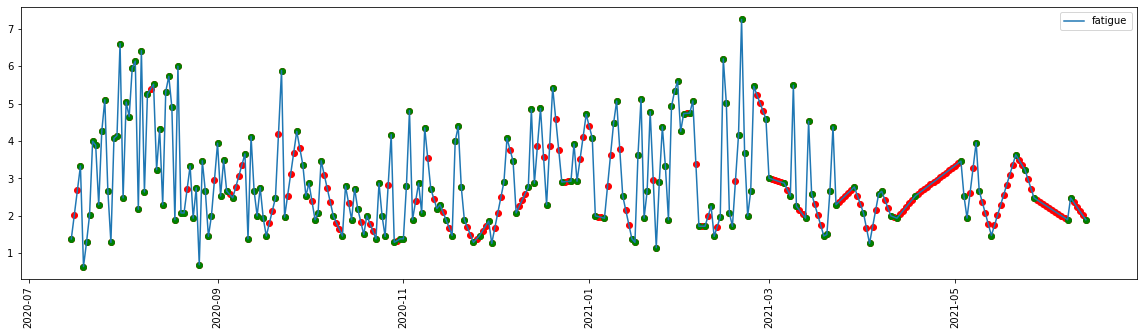
Looking at linear interpolation first
[11]:
ts = df[current_feature].interpolate(method="polynomial", order=1)
[12]:
_ = plt.figure(figsize=(20, 5))
_ = plt.plot(ts, label=current_feature)
_ = plt.scatter(ts.index, ts.values, c="red")
_ = plt.scatter(df[current_feature].index, df[current_feature].values, c="green")
_ = plt.xticks(rotation=90)
_ = plt.legend()
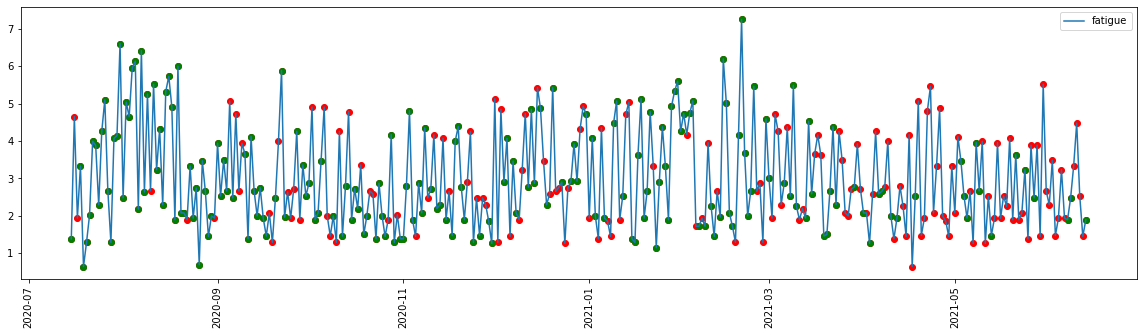
Deciding on the MICE algorithm in the end
[13]:
# Create kernel.
kds = mf.KernelDataSet(
  df,
  save_all_iterations=True,
  random_state=1991
)

# Run the MICE algorithm for N amount of iterations
kds.mice(iterations = 10)

# Return the completed kernel data
completed_data = kds.complete_data()
[14]:
ts = completed_data[current_feature]
[15]:
_ = plt.figure(figsize=(20, 5))
_ = plt.plot(ts, label=current_feature)
_ = plt.scatter(ts.index, ts.values, c="red")
_ = plt.scatter(df[current_feature].index, df[current_feature].values, c="green")
_ = plt.xticks(rotation=90)
_ = plt.legend()
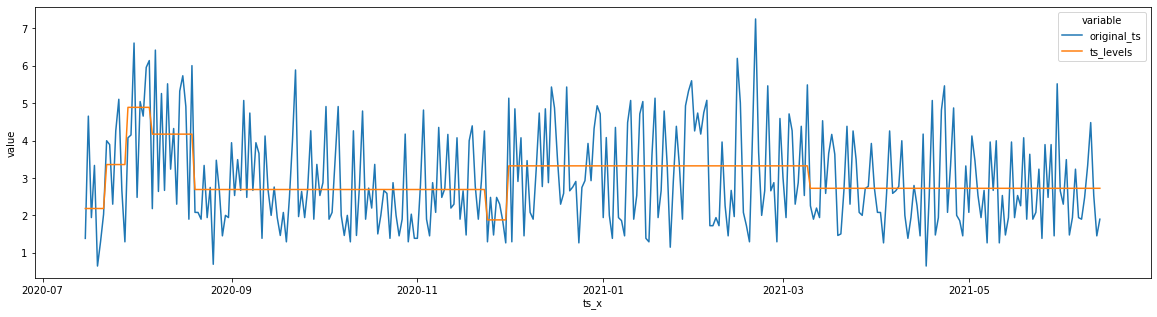
[16]:
ts_levels_df, _, _ = ts_levels(ts=ts.values,
    ts_x=ts.index,
    criterion='mse',
    max_depth=3,
    min_samples_leaf=1,
    min_samples_split=2,
    max_leaf_nodes=30,
    plot=False,
    equal_spaced=True,
    n_x_ticks=10,
    figsize=(20, 5))
[17]:
plot_df = ts_levels_df.drop("t_steps", axis=1).melt("ts_x")
[18]:
_ = plt.figure(figsize=(20, 5))
_ = sns.lineplot(data=plot_df, x="ts_x", y="value", hue="variable")
[19]:
def change_profile(x, window_size):
#     window_size = 5
#     x=ts
    window_range = np.arange(0, len(x)-window_size, window_size)

    cp_df = pd.DataFrame()
    for window_begin in window_range:
        window_mean = x.iloc[window_begin: window_begin + window_size].mean()
        window_sum = x.iloc[window_begin: window_begin + window_size].sum()

#         current_cp_df = x.iloc[window_begin: window_begin + window_size] - window_mean

        current_cp_df = (x.iloc[window_begin: window_begin + window_size] - window_sum) / window_size
        cp_df = pd.concat([cp_df, current_cp_df])

    return cp_df[0]
[20]:
ts_cp = change_profile(ts, window_size=6)
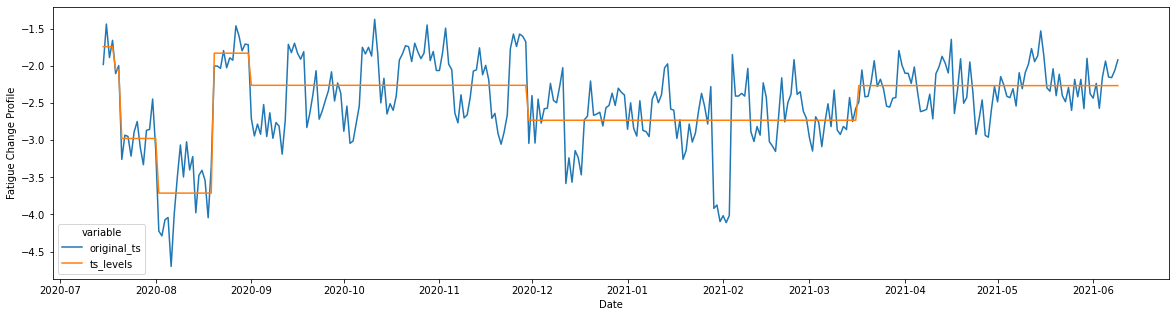
[21]:
ts_levels_df, _, _ = ts_levels(ts=ts_cp.values,
    ts_x=ts_cp.index,
    criterion='mse',
    max_depth=3,
    min_samples_leaf=1,
    min_samples_split=2,
    max_leaf_nodes=30,
    plot=False,
    equal_spaced=True,
    n_x_ticks=10,
    figsize=(20, 5))
[22]:
plot_df = ts_levels_df.drop("t_steps", axis=1).melt("ts_x")
[23]:
_ = plt.figure(figsize=(20, 5))
_ = sns.lineplot(data=plot_df, x="ts_x", y="value", hue="variable")
_ = plt.ylabel("Fatigue Change Profile")
_ = plt.xlabel("Date")
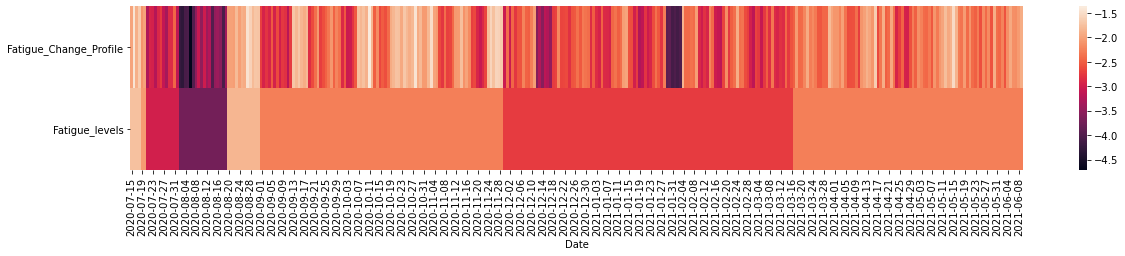
[24]:
plot_df = (ts_levels_df
 .drop(["t_steps"], axis=1)
 .rename(columns={"original_ts": "Fatigue_Change_Profile",
                  "ts_levels": "Fatigue_levels",
                  "ts_x": "Date"})
           .assign(Date=lambda x: x["Date"].astype(str))
 .set_index("Date")
)
[25]:
_ = plt.figure(figsize=(20, 3))
_ = sns.heatmap(plot_df.T)
[26]:
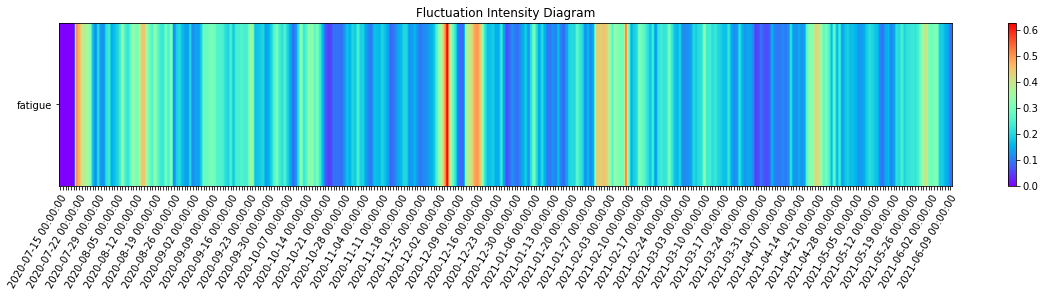
fi_df = pd.DataFrame(fluctuation_intensity(pd.DataFrame(ts_cp), win=7, xmin=0, xmax=1, col_first=1, col_last=1)).rename(columns={0: current_feature})
[27]:
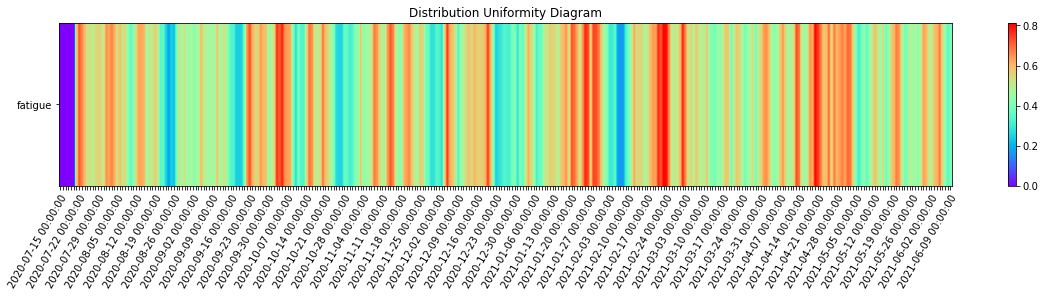
di_df = pd.DataFrame(distribution_uniformity(pd.DataFrame(ts_cp), win=7, xmin=0, xmax=1, col_first=1, col_last=1)).rename(columns={0: current_feature})
[28]:
cr_df = complexity_resonance(fi_df, di_df).rename(columns={0: current_feature})
[29]:
_ = complexity_resonance_diagram(fi_df, cmap_n=12, plot_title='Fluctuation Intensity Diagram', labels_n=7, figsize=(20, 3))
[30]:
_ = complexity_resonance_diagram(di_df, cmap_n=12, plot_title='Distribution Uniformity Diagram', labels_n=7, figsize=(20, 3))
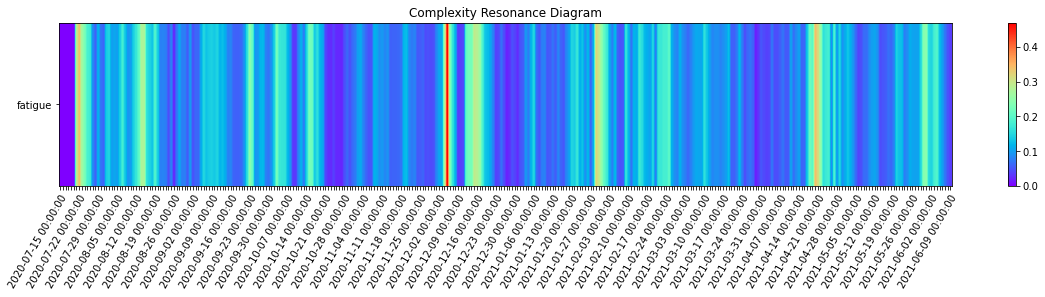
[31]:
_ = complexity_resonance_diagram(cr_df, cmap_n=12, plot_title='Complexity Resonance Diagram', labels_n=7, figsize=(20, 3))
[32]:
cumulative_complexity_peaks_df, significant_peaks_df = cumulative_complexity_peaks(df=cr_df,
                                                                                    significant_level_item = 0.05,
    significant_level_time = 0.05)
[33]:
_ = cumulative_complexity_peaks_plot(cumulative_complexity_peaks_df=cumulative_complexity_peaks_df,
                                     significant_peaks_df=significant_peaks_df,
                                    figsize = (20, 3),
    height_ratios = [1, 3],
    labels_n = 7)
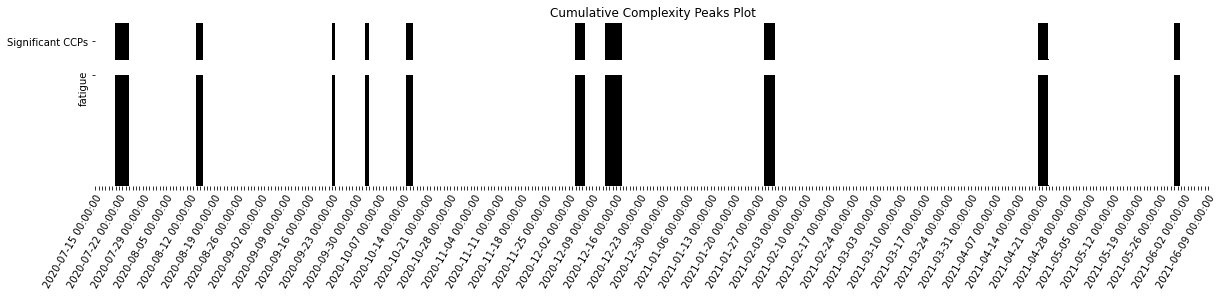
[34]:
significant_peaks_df[significant_peaks_df["Significant CCPs"]==1]
[34]:
| Significant CCPs | |
|---|---|
| 2020-07-21 | 1.0 |
| 2020-07-22 | 1.0 |
| 2020-07-23 | 1.0 |
| 2020-07-24 | 1.0 |
| 2020-08-14 | 1.0 |
| 2020-08-15 | 1.0 |
| 2020-09-23 | 1.0 |
| 2020-10-03 | 1.0 |
| 2020-10-15 | 1.0 |
| 2020-10-16 | 1.0 |
| 2020-12-04 | 1.0 |
| 2020-12-05 | 1.0 |
| 2020-12-06 | 1.0 |
| 2020-12-13 | 1.0 |
| 2020-12-14 | 1.0 |
| 2020-12-15 | 1.0 |
| 2020-12-16 | 1.0 |
| 2020-12-17 | 1.0 |
| 2021-01-29 | 1.0 |
| 2021-01-30 | 1.0 |
| 2021-01-31 | 1.0 |
| 2021-04-20 | 1.0 |
| 2021-04-21 | 1.0 |
| 2021-04-22 | 1.0 |
| 2021-05-30 | 1.0 |
| 2021-05-31 | 1.0 |
Running the CRDs on all the columns out of curiosity (not very reliable due to amount of missingness)
[35]:
df.info()
<class 'pandas.core.frame.DataFrame'>
DatetimeIndex: 334 entries, 2020-07-15 to 2021-06-13
Freq: D
Data columns (total 5 columns):
 #   Column                  Non-Null Count  Dtype
---  ------                  --------------  -----
 0   validated_physical      86 non-null     float64
 1   validated_cognitive     113 non-null    float64
 2   validated_motivational  77 non-null     float64
 3   fatigue                 190 non-null    float64
 4   slider                  62 non-null     float64
dtypes: float64(5)
memory usage: 23.8 KB
[36]:
completed_data.info()
<class 'pandas.core.frame.DataFrame'>
DatetimeIndex: 334 entries, 2020-07-15 to 2021-06-13
Freq: D
Data columns (total 5 columns):
 #   Column                  Non-Null Count  Dtype
---  ------                  --------------  -----
 0   validated_physical      334 non-null    float64
 1   validated_cognitive     334 non-null    float64
 2   validated_motivational  334 non-null    float64
 3   fatigue                 334 non-null    float64
 4   slider                  334 non-null    float64
dtypes: float64(5)
memory usage: 23.8 KB
[37]:
# completed_data.describe()
[38]:
scal_df = pd.DataFrame(MinMaxScaler().fit_transform(completed_data),
             columns = completed_data.columns,
            index = completed_data.index)
[39]:
fi_df = pd.DataFrame(fluctuation_intensity(scal_df, win=7, xmin=0, xmax=1, col_first=1, col_last=completed_data.shape[1]))#.rename(columns={0: current_feature})
[40]:
di_df = pd.DataFrame(distribution_uniformity(scal_df, win=7, xmin=0, xmax=1, col_first=1, col_last=completed_data.shape[1]))#.rename(columns={0: current_feature})
[41]:
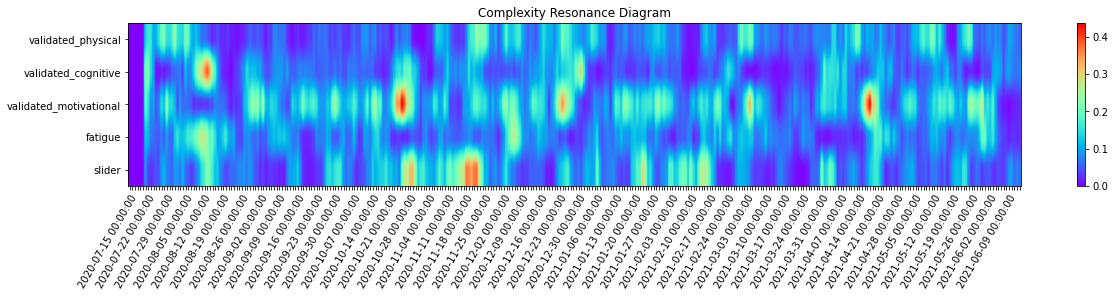
cr_df = complexity_resonance(fi_df, di_df)#.rename(columns={0: current_feature})
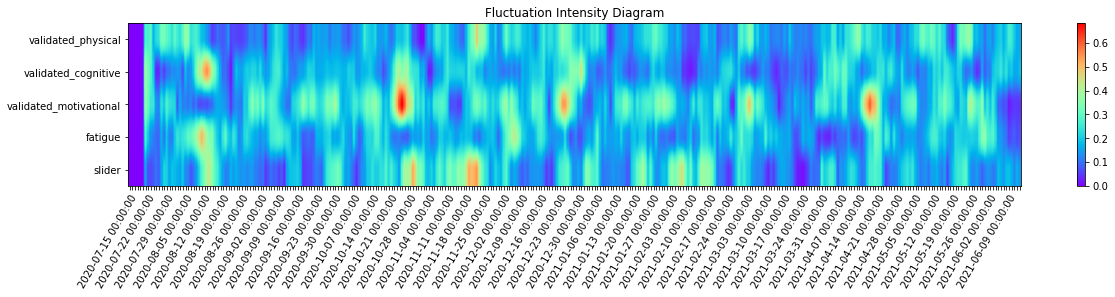
[42]:
_ = complexity_resonance_diagram(fi_df, cmap_n=12, plot_title='Fluctuation Intensity Diagram', labels_n=7, figsize=(20, 3))
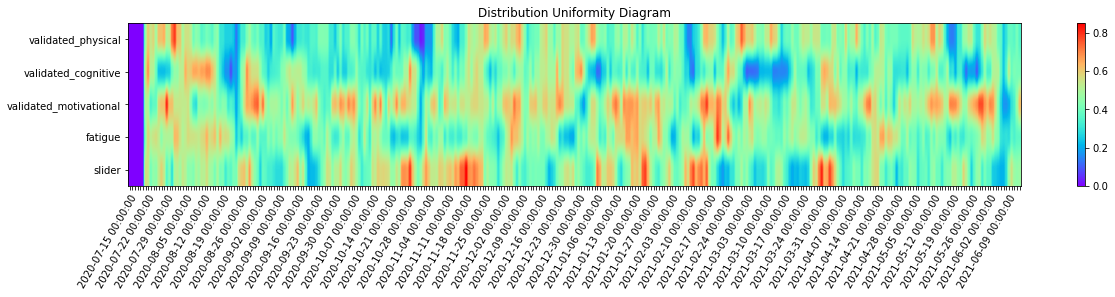
[43]:
_ = complexity_resonance_diagram(di_df, cmap_n=12, plot_title='Distribution Uniformity Diagram', labels_n=7, figsize=(20, 3))
[44]:
_ = complexity_resonance_diagram(cr_df, cmap_n=12, plot_title='Complexity Resonance Diagram', labels_n=7, figsize=(20, 3))
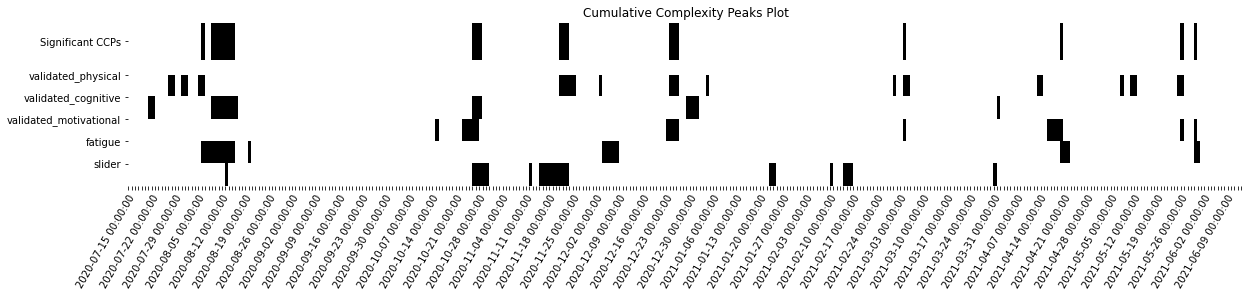
[45]:
cumulative_complexity_peaks_df, significant_peaks_df = cumulative_complexity_peaks(df=cr_df,
                                                                                    significant_level_item = 0.05,
    significant_level_time = 0.05)
[46]:
_ = cumulative_complexity_peaks_plot(cumulative_complexity_peaks_df=cumulative_complexity_peaks_df,
                                     significant_peaks_df=significant_peaks_df,
                                    figsize = (20, 3),
    height_ratios = [1, 3],
    labels_n = 7)
[ ]: